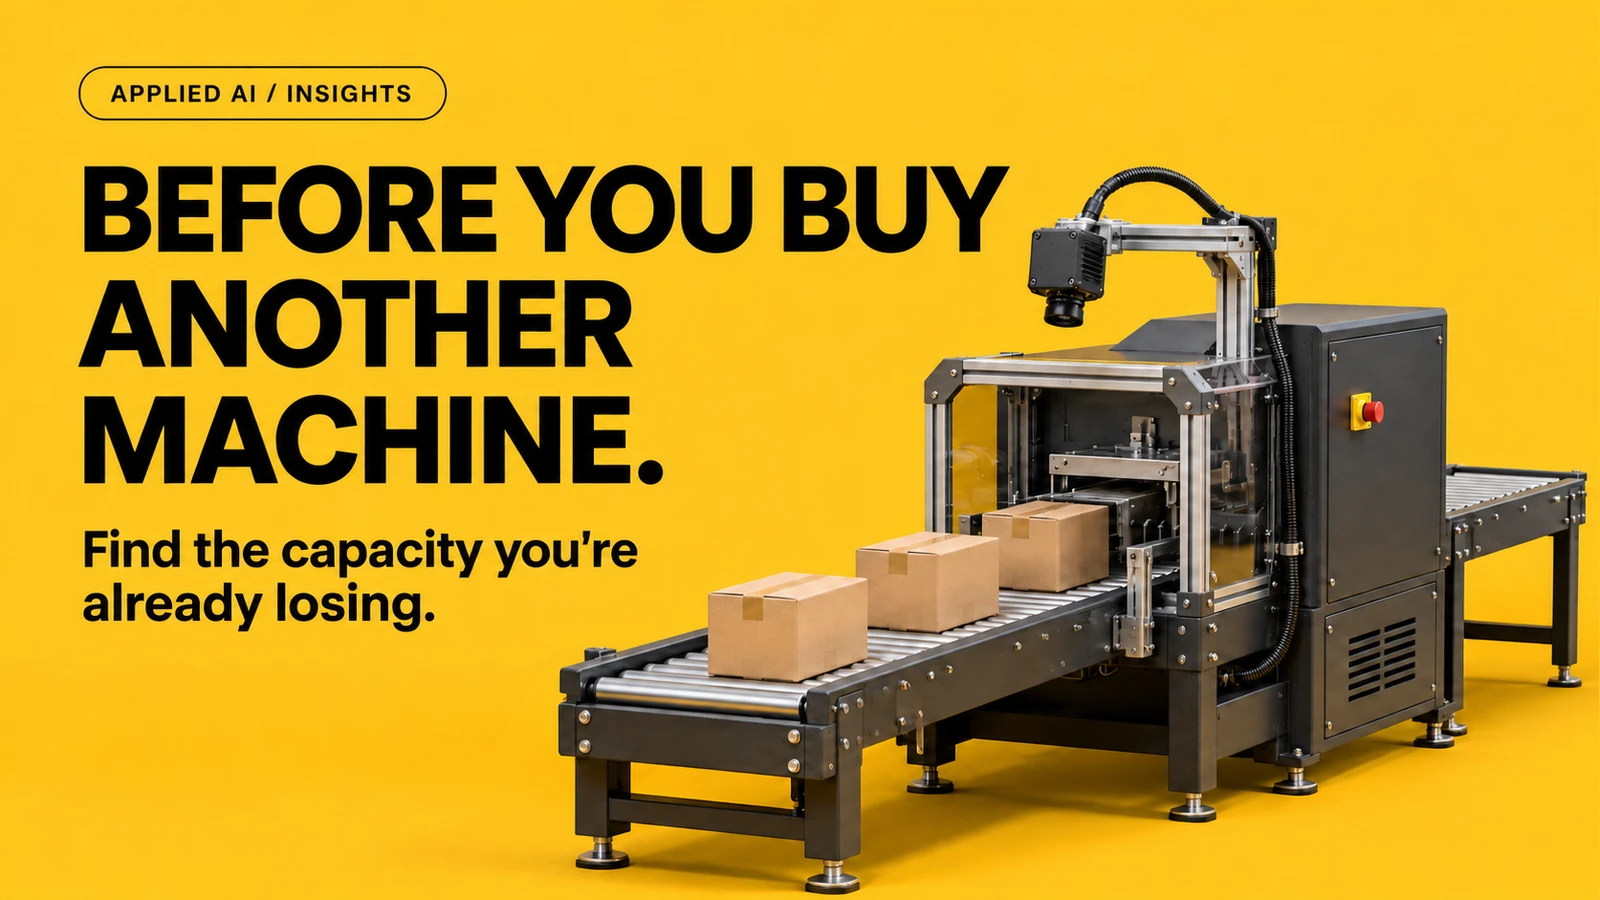
The order book is growing. Production is running overtime. Deliveries are getting harder to promise.
Someone puts a quotation for another machine on the table.
It may be exactly the right investment. But before approving it, there is a question worth answering: how much of the capacity you already own is reaching the end of the line as good product?
A machine can look busy throughout a shift and still spend a surprising amount of that shift waiting. Waiting for material. Waiting for the next station to clear. Recovering from a brief interruption that nobody records because production is already moving again.
Those losses are easy to miss in a daily total. Together, they can influence whether the next step should be new equipment, another shift or a targeted improvement to the line you already have.
For manufacturers and processors considering capital expenditure, finding that out first can change both the size of the investment and where it belongs.
The machine that stops may be waiting for something else
Imagine a packaging line where the filler repeatedly falls behind its target. The obvious proposal is a faster filler.
Now look at a single interruption in detail. In this illustrative scenario:
- At 10:14:00, a skewed carton interrupts the downstream cartoner.
- At 10:14:08, product begins accumulating on the conveyor between the machines.
- At 10:14:21, the buffer fills and the filler stops because it has nowhere to send its output.
The filler has recorded lost time. The interruption began elsewhere.
A faster filler would reach that same full buffer sooner. The first investigation belongs at the cartoner entry: guides, carton condition, product presentation and the settings used for that production run.
That sequence is the reason to look beyond the machine attracting the most attention. A production constraint needs to be understood in the context of the flow around it. The Theory of Constraints provides an established approach: identify what limits throughput, improve it, then check where the constraint moves.
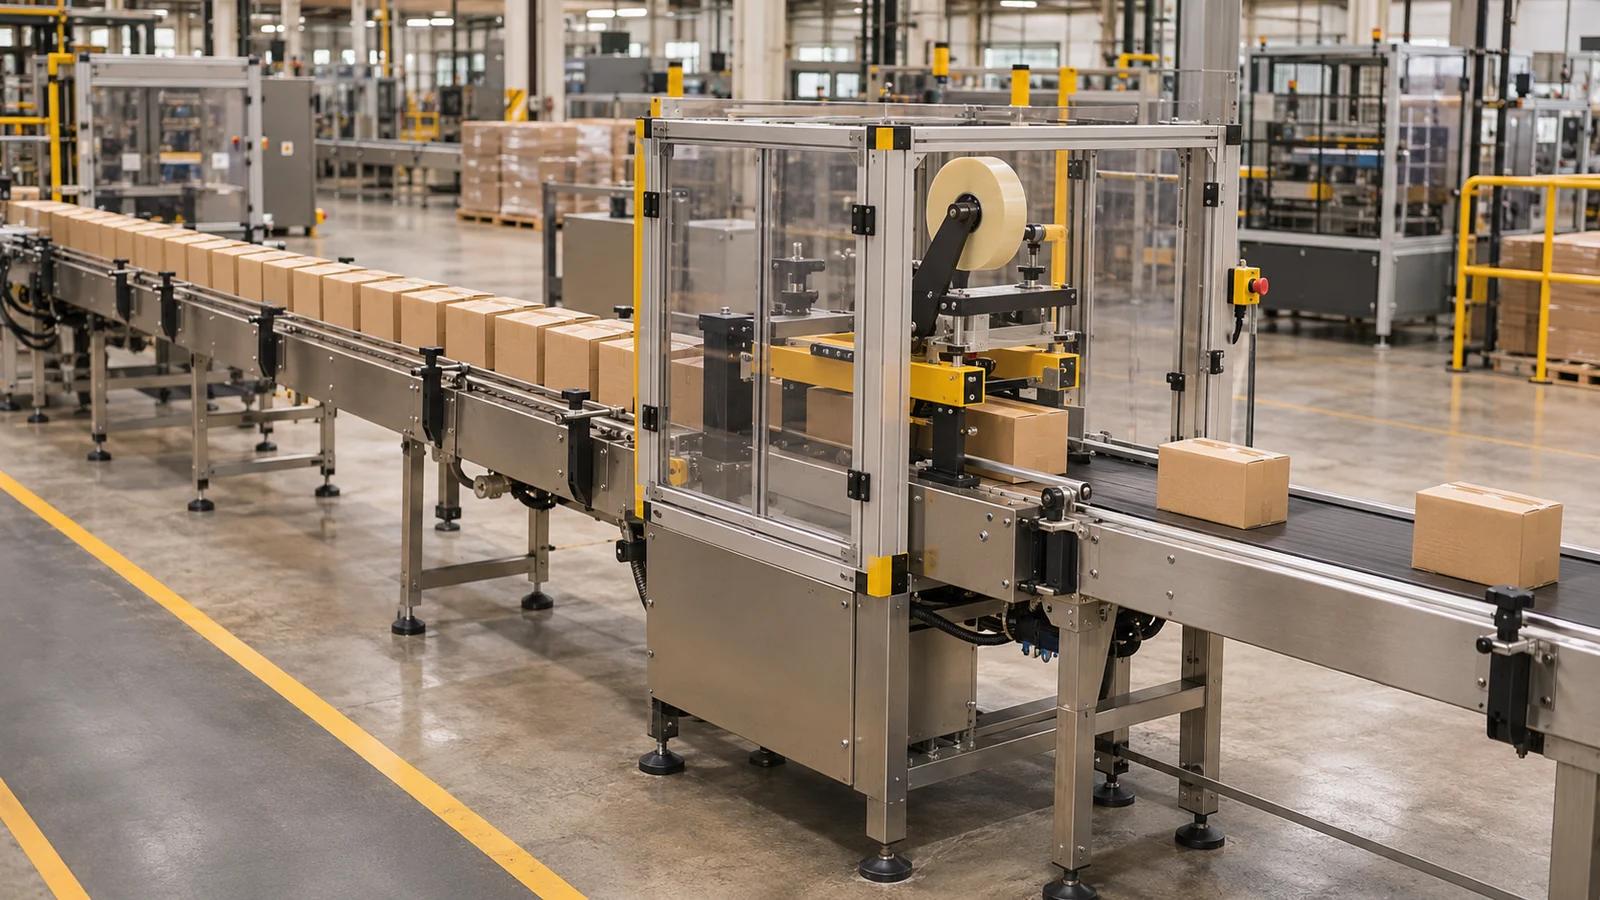
AI-generated illustration of uneven product flow. A queue identifies a place to investigate; the event history is needed to establish its cause.
The losses that disappear inside a shift total
A major breakdown gets a maintenance call and an explanation. A twenty-second pause may get neither.
The operator clears it, the line restarts and everyone carries on. That is a sensible immediate response. It also makes the pattern difficult to quantify if the system only records longer stops.
Several different losses can sit behind the same disappointing total:
Small stops. A misfeed, a momentary jam or a sensor that needs clearing. Each event is brief; repeated events consume production time.
Inconsistent feeding. A machine is available to work but receives material in bursts. Increasing its maximum speed will not fix the gaps between those bursts.
Reduced running speed. The line is moving, but below the appropriate reference rate for the product. There may be a good reason: material quality, an unstable transfer or a downstream operation that cannot keep up.
Rework and rejects. Equipment processes units that will not become acceptable finished product on that pass. Rework can then compete with new orders for time at the same constrained station.
Downstream congestion. Finished items cannot leave a station quickly enough. Packing, handling or available buffer space may be limiting the flow.
These are familiar manufacturing problems. The Six Big Losses framework groups equipment losses into failures, setups, minor stops, reduced speed and quality losses. The practical challenge is determining which events matter on your line, how often they occur and what happens immediately before them.
Start with the output the business needs
Before measuring everything, define the shortfall.
Which products are missing their delivery targets? How many additional acceptable units are needed per shift? Does the problem happen throughout the product range or mainly on one format, batch size or changeover?
Measure good output at a clearly defined point. Agree how rejects, rework and unfinished stock are counted. Ten thousand machine cycles and ten thousand saleable products are different records.
Then observe representative production. Include the products, shifts, changeovers and material conditions relevant to the proposed investment. One smooth demonstration run will tell you little about the mix that keeps production working late.
If you already track overall equipment effectiveness, or OEE, use it to help locate the loss. OEE combines availability, performance and quality; its calculation depends on a defined production window, reference cycle time and good count. Check those definitions before comparing machines or shifts. A score alone does not tell you which equipment to buy.
Put machine signals, visual events and production records on the same timeline
Much of the evidence may already exist. The difficulty is connecting it closely enough to reconstruct what happened.
Machine signals show the sequence
Start with the available PLC and control-system information: run status, fault states, cycle counts, speeds and signals indicating that a machine is waiting for material or unable to discharge product.
Confirm what each signal actually means. A motor-running signal does not necessarily mean product is being processed. Capture events frequently enough to resolve the interruptions under investigation, and align timestamps across the relevant equipment.
This can establish whether a machine stopped first or responded to a problem upstream or downstream.
Cameras show the physical event
A signal may report that an infeed is blocked. The image can show a carton arriving at an angle, products bunching together or a transfer that repeatedly hesitates.
Computer vision can turn defined visible conditions into searchable events: a queue building, a gap in supply, an obstructed transfer or an item entering a rework path. Linking those events to machine states helps engineers find and review the relevant moments.
Existing footage may be useful, provided its view, frame rate and timestamps suit the question. Otherwise, a camera placed at the suspected transfer point may provide better evidence than adding cameras throughout the plant.
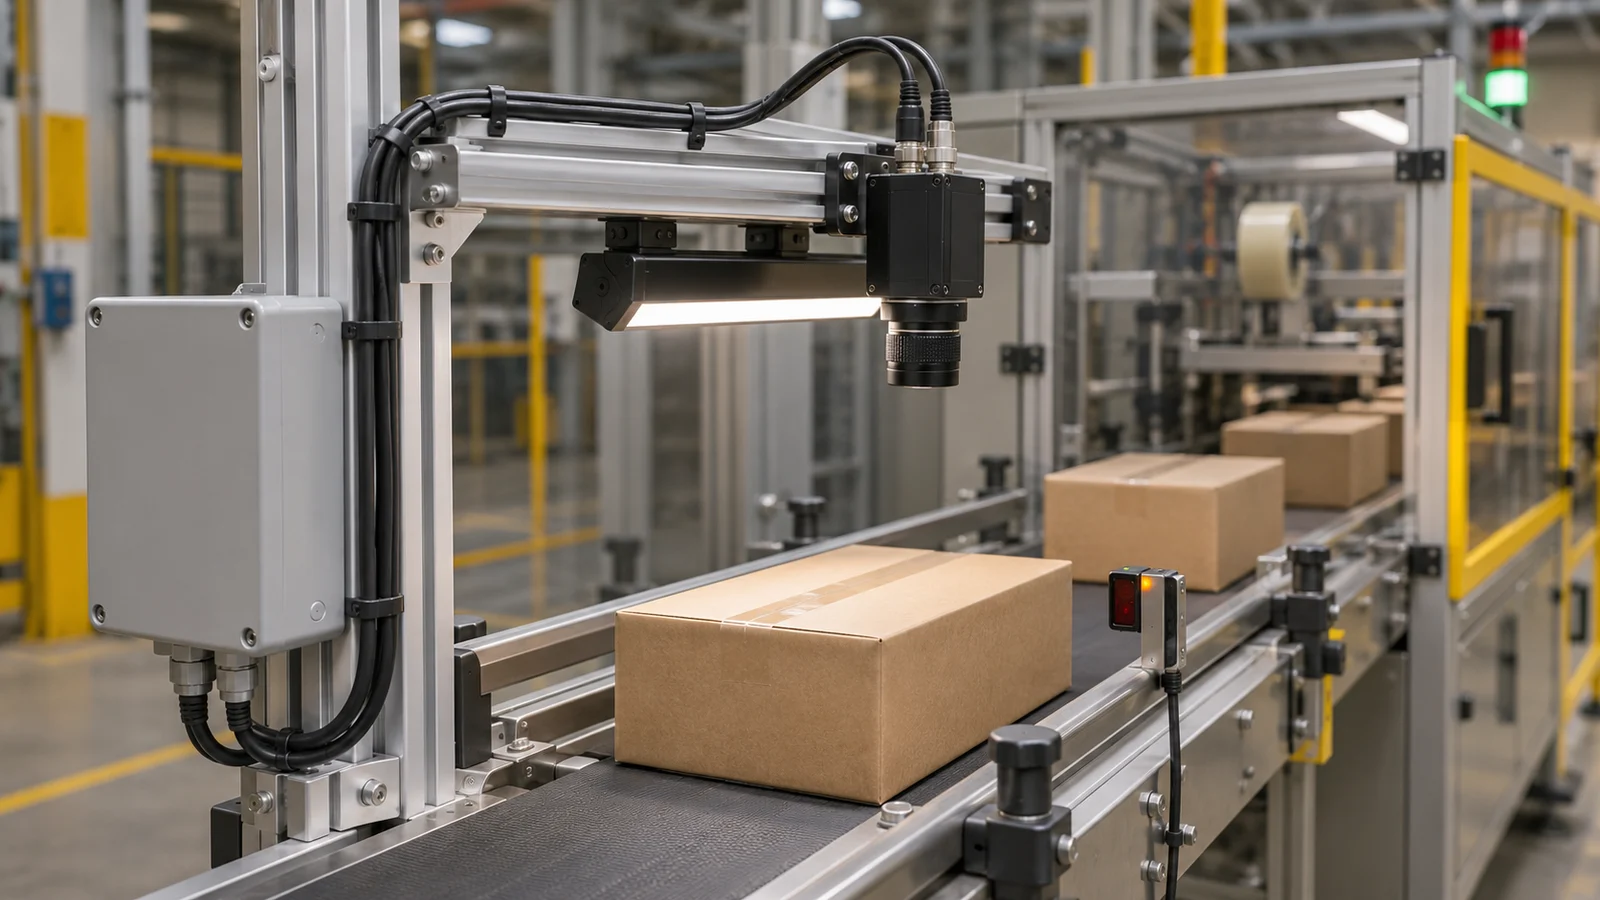
AI-generated illustration of a retrofit observation point. Camera placement is chosen around the event the team needs to understand.
Production records explain the conditions
Add product code, batch, material lot, recipe, changeover, reject and maintenance records where available. Include the operator's explanation of what they saw and changed.
Repeated interruptions may cluster around one packaging format or material delivery. A shift comparison may look very different once you account for product mix and the number of changeovers.
The combined record gives the team a testable question: does this transfer start hesitating when this format runs, and does the hesitation disappear after the guide adjustment?
That is where the investigation becomes useful. AI can help locate and classify the observations; engineers and operators still need to check the proposed cause against the process and the result of a change.
Turn the observed loss into a realistic capacity opportunity
Consider a simple worked example. These are illustrative numbers, not results from a Zenaight installation.
A review finds 60 separate twenty-second interruptions during a shift. They total 20 minutes. The events are measured at the station currently constraining the line, and their durations do not overlap.
Suppose a targeted change could remove half of that time. At a validated operating rate of 60 good units per minute, those ten minutes represent 600 additional good units per shift in the initial capacity estimate.
That estimate needs checking in production. Material supply and downstream operations must support the extra flow, quality must hold, and the recovered minutes must actually become additional finished output.
Do not add the same interruption several times because several machines stopped. A cartoner fault, the resulting conveyor backup and the filler stop may all describe one event propagating through the line.
Also separate available capacity from its commercial value. If there are orders for the additional output, assess the contribution after incremental costs. If the benefit is avoiding overtime, quantify that instead. A theoretical production gain is not automatically extra revenue.
This gives management a comparison it can use: the cost and expected benefit of recovering existing capacity against the cost, timing and capability of the proposed machine.
Change one thing, then check the whole line
An investigation should finish with an intervention and a measured result.
That intervention might be a guide adjustment, a revised replenishment routine, maintenance on a recurring fault, a changeover improvement or additional buffer capacity where the process permits it. Some findings will justify more substantial engineering.
Compare performance under similar product and operating conditions. Check good output, rejects, rework and the behaviour of adjacent stations. Keep required safety, cleaning and quality steps in the production plan.
A local improvement can move the constraint. If the cartoner now runs consistently but the next station cannot accept the output, the capacity question has changed. Measure that next limitation before counting the full improvement as a lasting gain.
The evidence should be clear enough to explain what changed, which loss fell and how much additional acceptable product left the line.
When another machine is the right answer
Better visibility can strengthen the case for investment.
New equipment may be justified when the existing constraint is running consistently at its validated capacity and demand still exceeds output. The business may also need a capability the current equipment cannot provide: a new product format, a tighter tolerance, improved hygiene, a different process or greater resilience.
There are cases where repeated repairs and workarounds make replacement the more sensible decision. There are also growth plans that clearly require another line even after practical improvements have been made.
In those situations, the investigation gives you a better specification. You know the required sustained rate, the relevant product mix, the interfaces and the upstream and downstream changes needed to make the purchase deliver.
Buy against a measured requirement. That is a stronger position than buying against a shift total nobody can fully explain.
Find out what is limiting your operation
Zenaight brings together computer vision, connected hardware and IoT, and custom software to make production events measurable and usable.
For a capacity investigation, that can mean connecting existing signals, adding observation at a difficult transfer point and bringing the evidence into a shared event history. The scope follows the operational question and the information already available.
If you are considering another machine or an additional shift, bring the production shortfall, current process and available records to the conversation. We can help define how to measure the losses and evaluate where better visibility would support the decision.
Talk to Zenaight about the capacity you need to find.
For related reading, explore our industrial computer vision cost guide, production line counting article and manufacturing capabilities.