Tomorrow’s processing schedule is nearly locked. Two flocks come up at 2.1 kg. Across 1,000 houses, your production team has limited time for follow-up checks. Which house needs a second weighing today, and where should the team take it?
The answer matters before the plant commits to a run. A weight report that includes the likely mix of bird sizes can give the director a reason to keep the plan, ask for a recheck or revisit the flock allocation with processing. A three-camera example shows how that decision could work.
One house, three cameras, three different readings
In this illustrative example, a 45,000-bird house looks on target from its middle camera. By day 29, the rear is already falling behind the front. By day 35, the two ends are 360 g apart. The processing team could still see the middle’s 2.10 kg reading and assume the flock is on plan.
One camera samples each third of the house. At day 35, the middle view estimates 80% of its observations inside the example 2.0–2.2 kg band, compared with 25% at the rear.
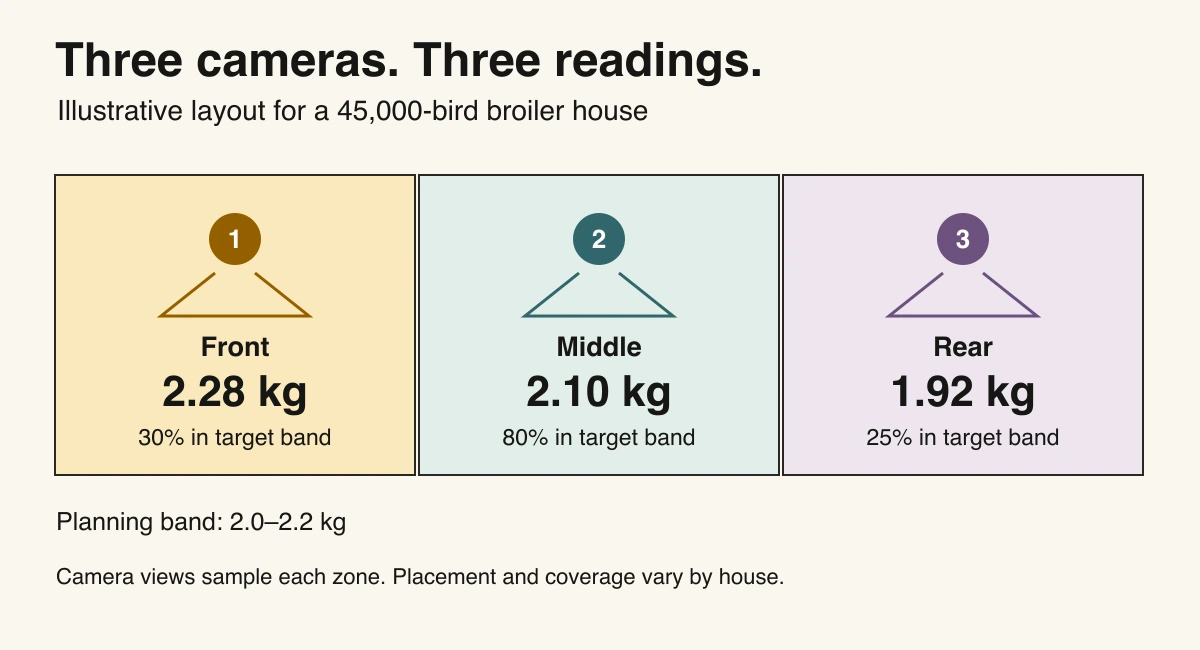
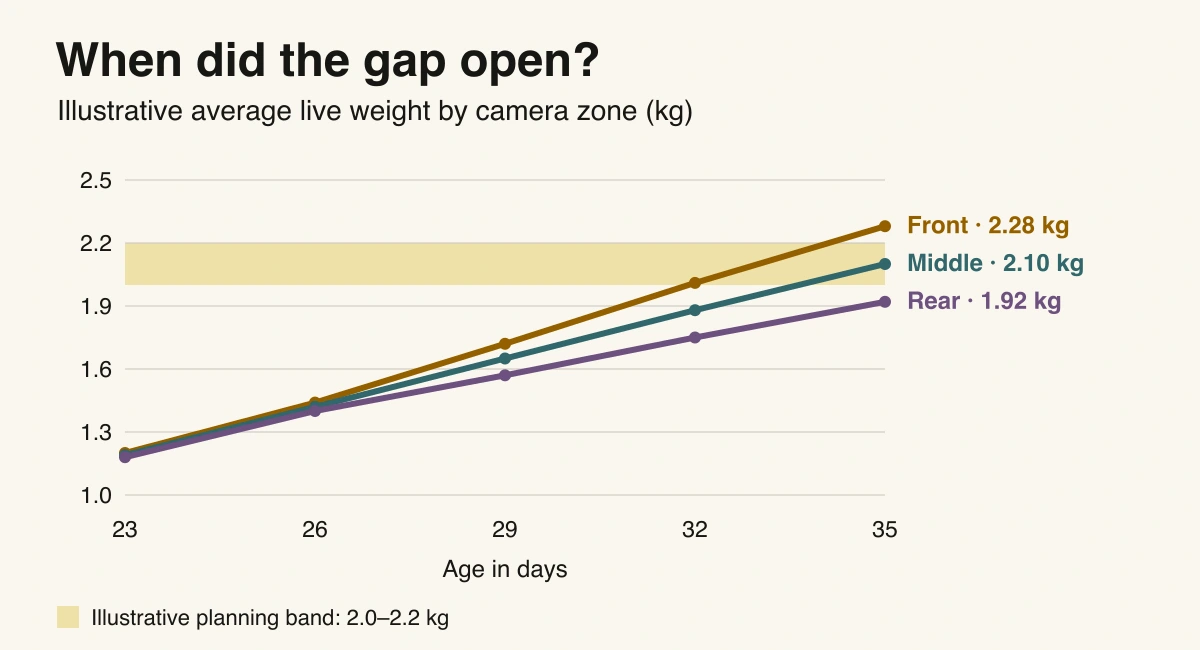
Illustrative camera estimates. The shaded band is the processor’s example live-weight range. A zone average inside the band can still include birds outside it.
In this example, the rear trend starts falling behind by day 29. That gives the manager a reason to walk that zone and check a scale sample while the flock is still growing. If the scale sample confirms the gap, the manager can check local conditions and flag the likely weight spread to the plant. If the scale disagrees, check camera coverage and sample quality first.
What to put on the director’s morning report
A director needs a list of houses to act on, ranked by how soon they’re due for catching and how much the latest evidence could change the processing plan. Start with the agreed weight band for each scheduled flock, the estimated share in it, the zone with the largest deviation and the time of the latest reliable observation. Put the comparison with the last physical sample next to the estimate.
- Check a zone today. A sustained divergence with usable camera coverage goes to the farm manager with the location and a request for a physical sample.
- Check the data first. If a camera has gone offline or has too few usable views, flag the estimate as incomplete and fall back to physical sampling where a scheduling decision is due.
- Review with processing. If a physical check confirms the mix has shifted, send the updated distribution and its timestamp to the plant so the planner can review the run or allocation.
The threshold for escalating should reflect the cost of acting too late and the number of follow-ups your teams can handle. Start on a small set of representative houses and track how many alerts led to a confirmed issue, how much notice they gave, and how many reweighs changed a farm or plant decision. That gives you a basis for deciding whether to roll it out across more sites.
Same average weight, different supply for the plant
Imagine two groups of 100 birds with an average live weight of 2.1 kg. For this example, the processor has agreed a live-weight planning range of 2.0 to 2.2 kg.
| Flock A | Flock B | |
|---|---|---|
| Average live weight | 2.1 kg | 2.1 kg |
| Below 2.0 kg | 5 birds | 30 birds |
| 2.0–2.2 kg | 90 birds | 40 birds |
| Above 2.2 kg | 5 birds | 30 birds |
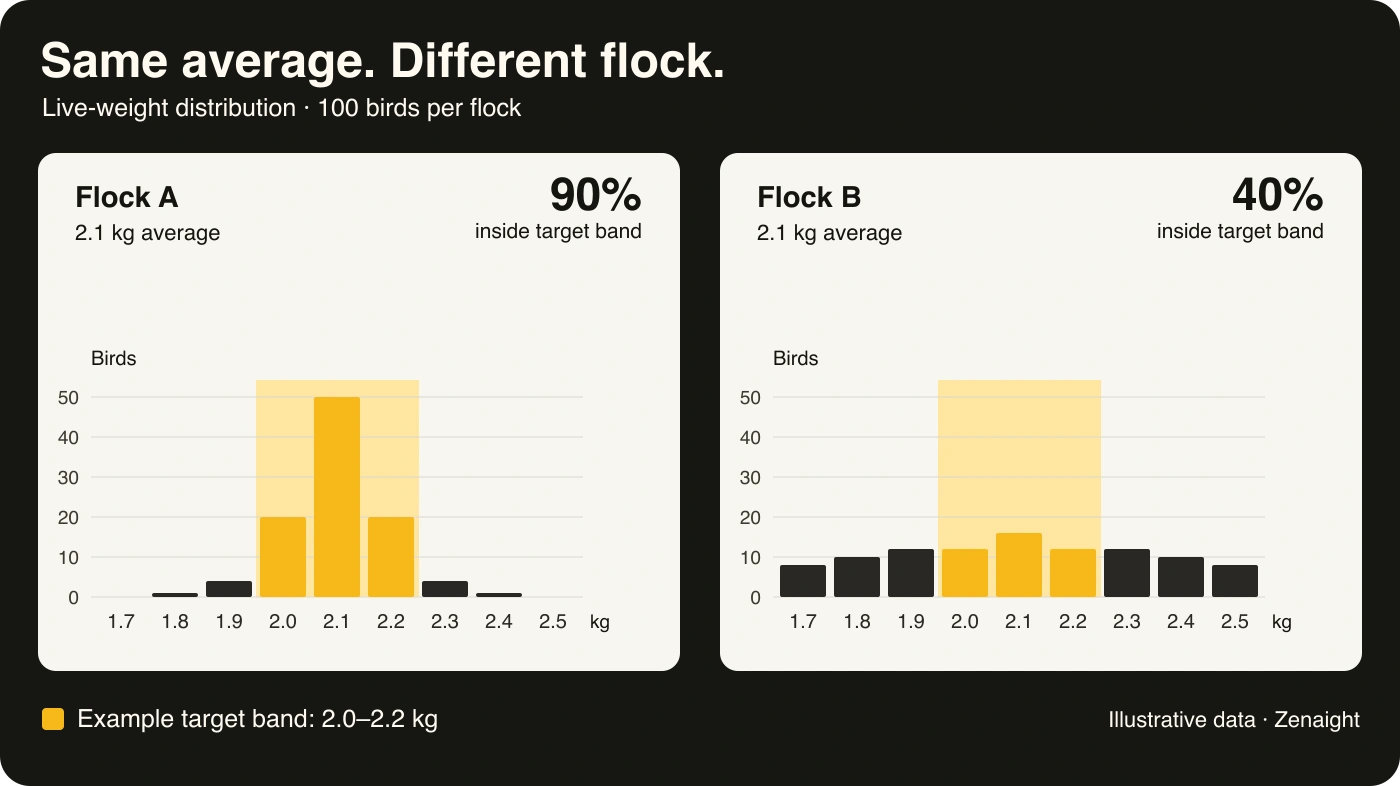
Illustrative data. The same live-weight band is applied to both flocks. It is an example planning range for this article.
The second group has just as many birds above the band as below it, so the extremes cancel out in the average. If the day’s programme depends on a narrower size range, those 60 birds outside it may affect how the plant plans grading and allocates output to orders. The decision also depends on what else the plant can run and what demand it has for those sizes.
Live weight is measured on the farm. Finished product specs are set at the plant. If a processor wants to use live weight to plan for a carcass or cut-weight target, the link between those measurements needs to come from its own processing data.
Why the birds you catch matter
In one flock documented by University of Georgia poultry specialists, body weights at the front and rear started to diverge around day 26. The rear had the heaviest birds, the front had the lightest, and the middle fell between them. The direction of the difference can vary by house and flock. The takeaway is to check it in your own shed. University of Georgia field report
Weighing 100 birds in a house of 30,000 to 60,000 covers about 0.17% to 0.33% of the flock. A small sample can still be useful when it represents the house. If a rushed check keeps returning to the same spot or picks the largest birds that happen to be easiest to catch, the reading can skew high. A convenience sample can skew the other way too.
Aviagen recommends sampling from at least three locations, away from walls and doors, and weighing every bird in the catching pen. Its guideline of at least 100 birds or 1% of the population, whichever is greater, means 300 to 600 birds at the house sizes above. Aviagen broiler management handbook
Three cameras give you repeated observations from different parts of the house between physical weighings, without someone choosing which bird to catch each time. Each zone can have its own growth trend and weight distribution. Keep those views separate in the report. A busy camera can generate many more usable measurements than another, so pooling every sighting can make its zone dominate the flock estimate. Check coverage and the physical references before rolling the zones into one house figure.
Flock uniformity and the processor’s weight band
Aviagen’s broiler management handbook describes two ways to summarise the spread of live weights. CV%, the coefficient of variation, expresses the standard deviation as a percentage of the mean. Uniformity % reports the share of birds within ±10% of that mean.
The share inside a processor’s target band answers a different question. At an average of 2.1 kg, Aviagen’s ±10% band spans 1.89–2.31 kg. The plant’s illustrative range is narrower. A flock can look acceptably uniform by the farm’s measure and still deliver fewer birds in the range the plant needs for a specific run.
A useful handover includes the average, the spread and the estimated share below, within and above the agreed band. It also says when the measurements were taken. Put those on the same report and the farm and plant can discuss the same flock with the same numbers.
What the camera actually measures
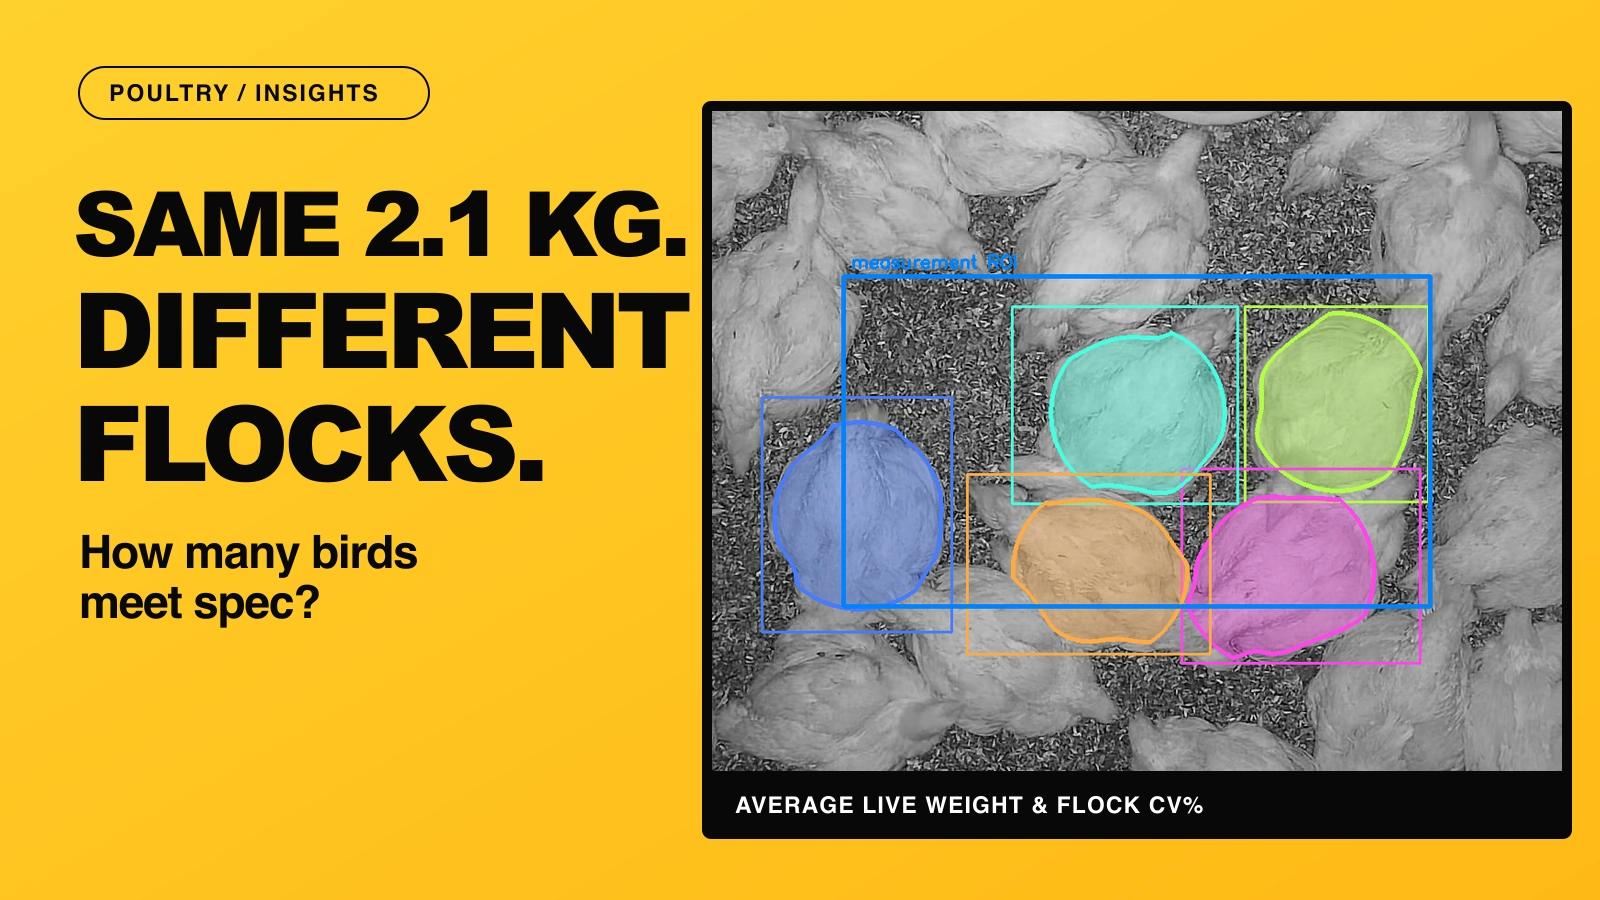
The overhead image on the cover shows a frame from Zenaight’s broiler monitoring development work. The boxes locate individual birds in the image. The coloured outlines identify the body area that can be measured. That distinction matters when birds are close together, partially obscured or cut off by the edge of the frame.
A camera system can collect images throughout the day, select usable views and estimate live weight from features such as projected body area and shape. Physical weights provide the reference for mapping those features to kilograms. Published work has demonstrated this approach using overhead depth images to isolate individual broilers and extract features for weight prediction. Broiler weight estimation study
For flock uniformity, which birds make it into the sample matters as much as how many measurements the system collects. A camera aimed at one feeder can repeatedly see the same part of the flock. At higher densities, a filter that accepts only clear outlines may favour birds in less crowded areas. More frames from that view can make the estimate look more stable while leaving the same sampling gap.
We’d choose views across representative parts of the house, track how many usable observations come from each view and look for gaps by time of day or stage of growth. The individual observations are measurement samples. Repeated sightings of one bird should never be reported as multiple unique birds.
Prove the distribution before you plan around it
A camera system can agree with the scale on average weight while underestimating the spread. If the model consistently pulls heavy and light birds towards the middle, it can overstate the share in spec even when the mean looks right.
We’d agree with the grower and processor what decisions the estimate should support, then compare the camera results with a representative physical weighing sample from the same house and time window. Use reference samples held apart from calibration, and check three things:
- Average live weight. How close are the estimates to the physical sample, and does the difference change with bird age or house conditions?
- Spread. Do the camera estimates reflect the range and CV% seen on the scale, including the lighter and heavier birds?
- The share in the target band. Does the camera report a similar proportion below, within and above the plant’s band? How often are birds close to a cutoff classified on the wrong side?
If coverage is low or the estimate is uncertain near a cutoff, the report should show that plainly. That gives the team a specific reason to check a physical sample before committing to the schedule.
Give the farm and the plant one useful view
Zenaight builds camera-based broiler monitoring to bring estimated live weight, flock variation and reference weights together across houses and growing cycles. The useful next step for a grower and processor is to agree which weight bands matter to their operation and test whether camera-based monitoring can report them reliably enough to support planning.
If you already weigh birds and want a clearer picture of flock uniformity between weighings, talk to Zenaight about the ranges you plan around and the measurements you already collect.
Explore our poultry computer vision work.